Unit Economics
Overview of Unit Economics
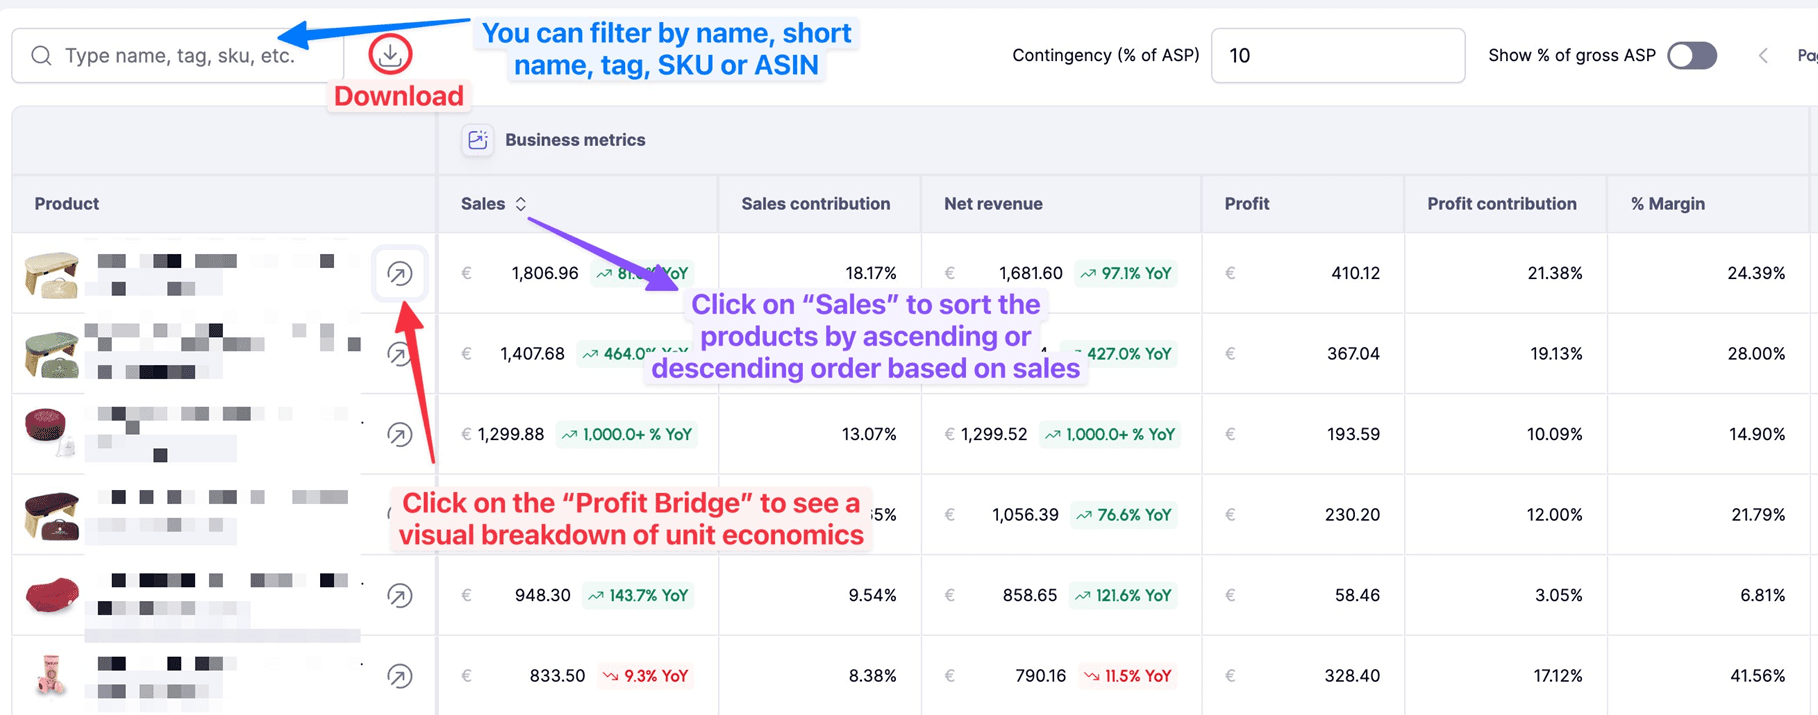
3fin’s Unit Economics page lets you understand your profitability at a product level and quickly understand which products are profitable and which ones are losing money. Thanks to its sorting feature, you can easily understand your portfolio split and see which products are your top sellers.
Unit Economics is based exclusively on shipped product sales (i.e. transactions on posted date) to only account for realized sales.

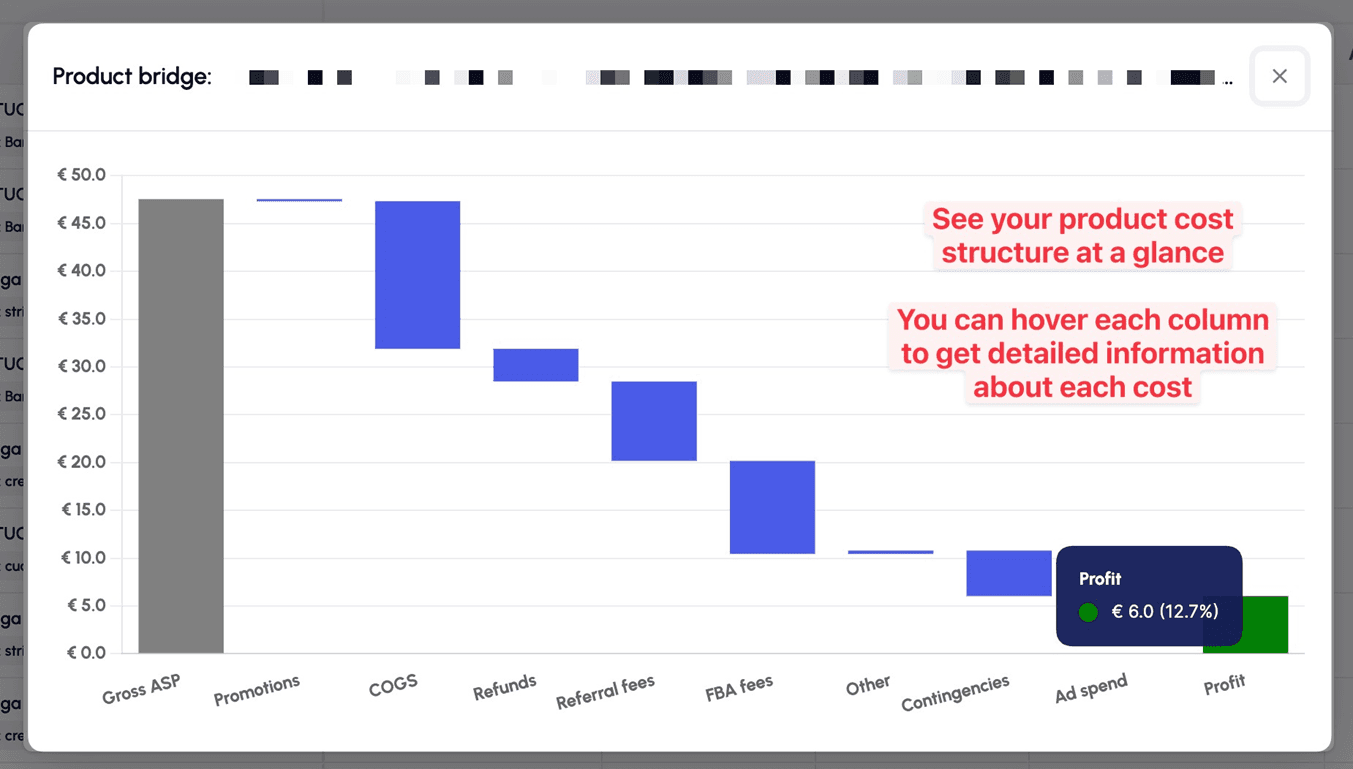
By clicking on a product, you can open a “Profit Bridge” to get a visual breakdown of that product’s unit economics (see picture below).

Unit Economics - Business Metrics Section
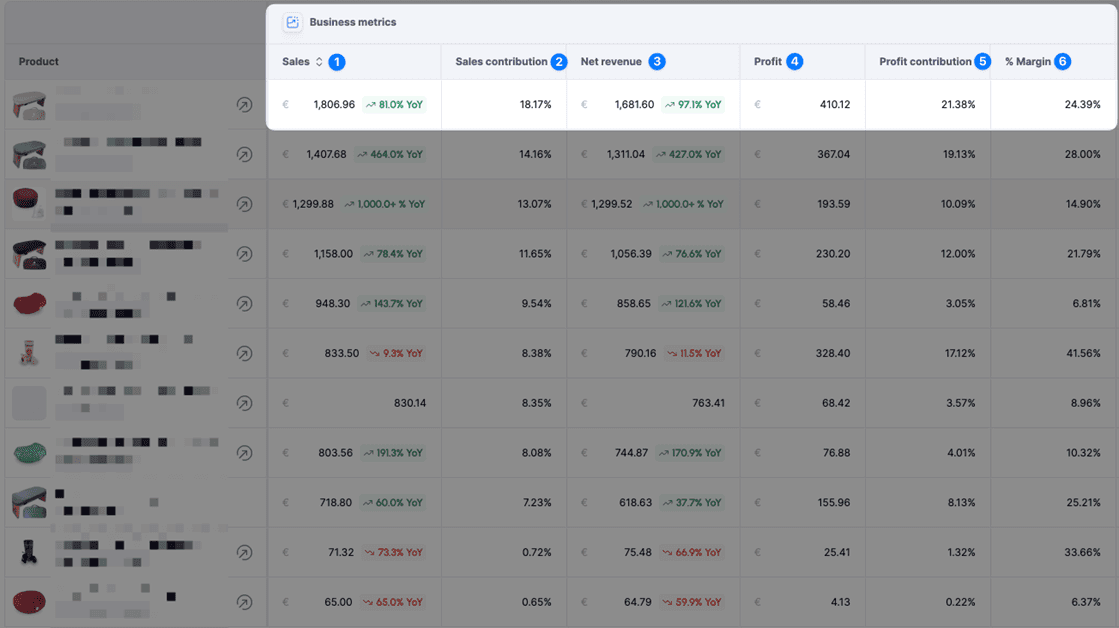
The left part of the unit economics table regroups all key business metrics. Here is a detailed breakdown of the business metrics section.

Sales: shows your product’s “gross revenue” for the selected period
Sales contribution: shows the product’s sales contribution over the selected period (for the selected marketplace(s))
Net revenue: shows your product’s “net revenue” for the selected period
Profit: shows your product’s profit for the selected period
Profit contribution: shows your product’s profit contribution for the selected period
% Margin: shows your product’s profit margin for the selected period
You can sort the Unit Economics table by Sales (ascending or descending).
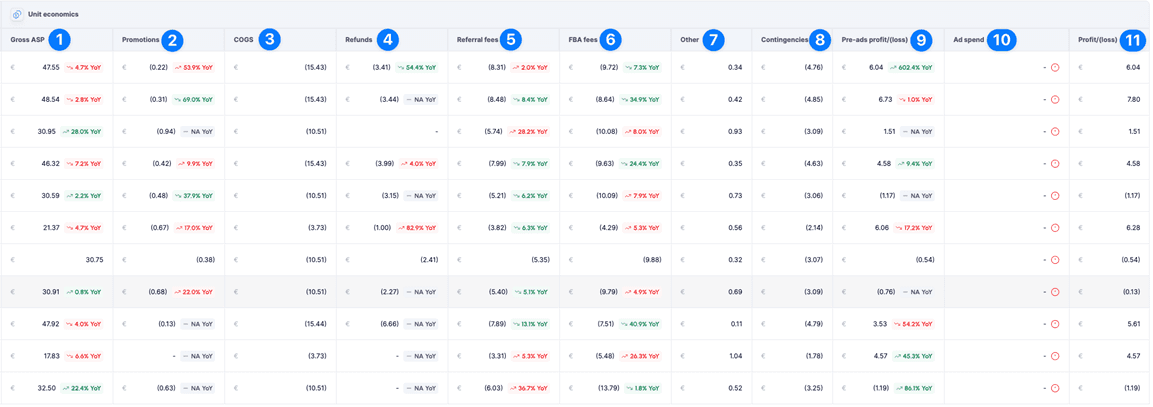
Unit Economics - “Unit Economics” Section

Gross ASP: Defined as gross revenue / units sold
Promotions: shows your product’s average promotion amount from coupons, lightning deals etc
COGS: shows your product’s average COGS
Refunds: shows your product’s average refund amount
Referral fees: shows your product’s referral fee
FBA fees: shows your product’s FBA fees
Other income / (cost): shows other costs associated with selling your product
Contingencies: shows the contingencies as % of Gross ASP you defined in the contingency bar.
Pre-ads profit/(loss): shows your product’s average profit before ads (corresponds to the contribution margin 2 on the profit & loss)
Ad spend: shows the ad spend from sponsored product and sponsored display attributed to your product
Profit/(loss): shows your product’s profit/(loss) after accounting for all the costs
FAQ - Unit Economics
What is a contingency?
The unit economics dashboard lets you add a “contingency” - a buffer for other costs such as storage costs, that are not included in the unit economics headers - to get a conservative and realistic view of your unit economics.
How can I add a contingency?
To add a contingency, simply enter the contingency amount as a percentage of the average selling price (ASP) in the contingency cell. We typically recommend adding a contingency of 1% of ASP.
How accurate is the Unit Economics Dashboard?
The Unit Economics Dashboard is highly accurate as it is based on shipped data, meaning it only includes transactions that have been fully processed by Amazon. However, it does not account for costs that cannot be directly linked to a specific product. Therefore, we recommend setting up a 1% contingency to cover account-level costs, such as storage fees, to ensure a more comprehensive view of your unit economics.