Trends
Trends Overview

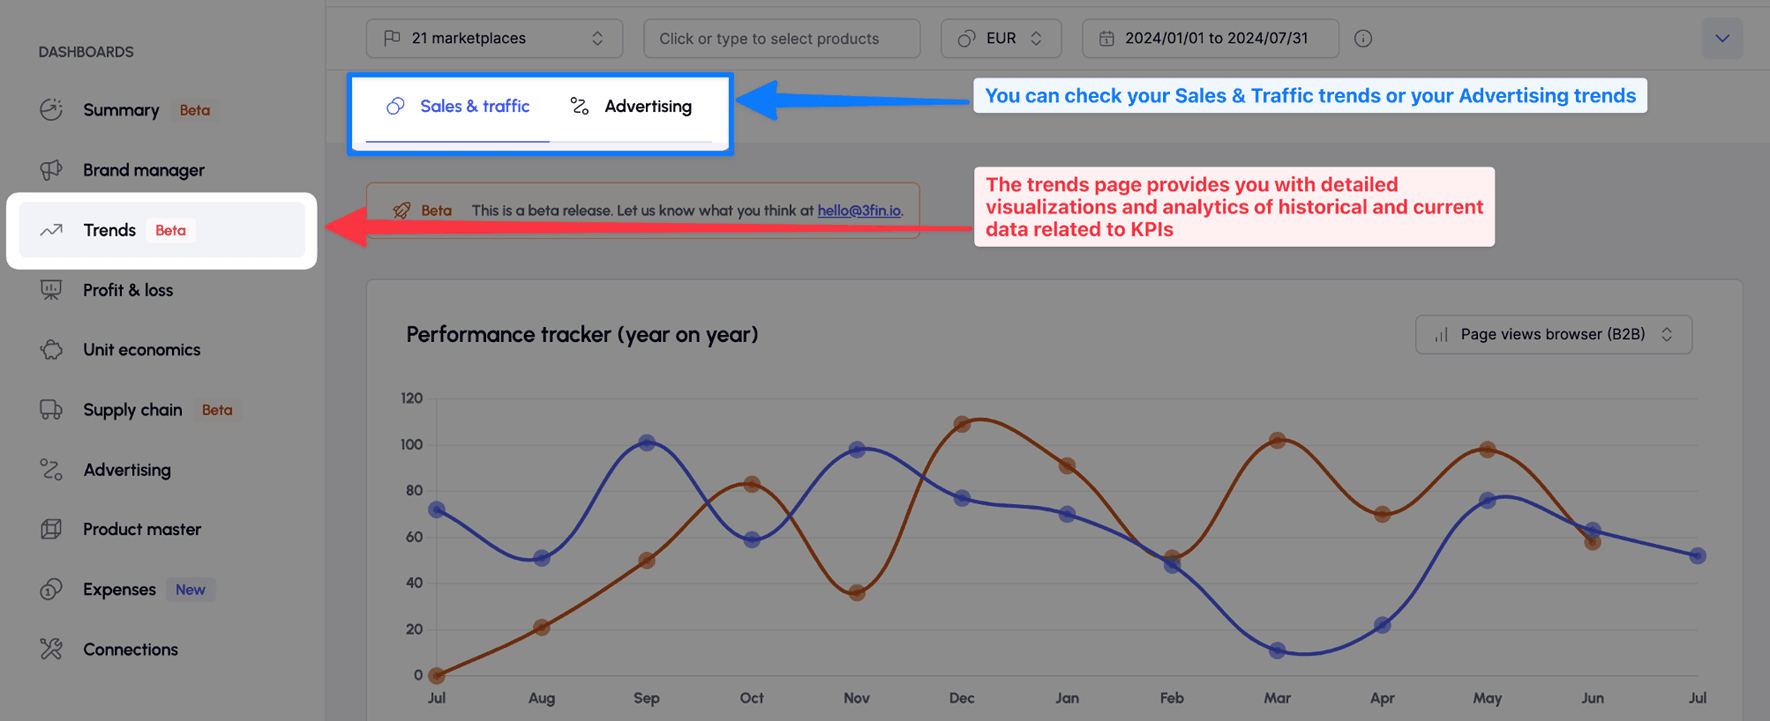
The Trends page is your essential dashboard for comprehensive visualizations and analytics of both historical and current key performance indicators (KPIs). By navigating to the Sales & Traffic or Advertising tabs, you can monitor your business trends across more than 80 different KPIs.
Utilize the Trends Dashboard to address key business questions, such as:
Is my year-over-year sales growth on track?
Are my sessions increasing?
How is my conversion rate trending?
Is there an upward trend in my average selling price?
Has the balance between organic and paid traffic shifted recently?
Is my TACOS (Total Advertising Cost of Sales) rising?
And more.
Performance Tracker (year on year) Chart

Using the Performance Tracker
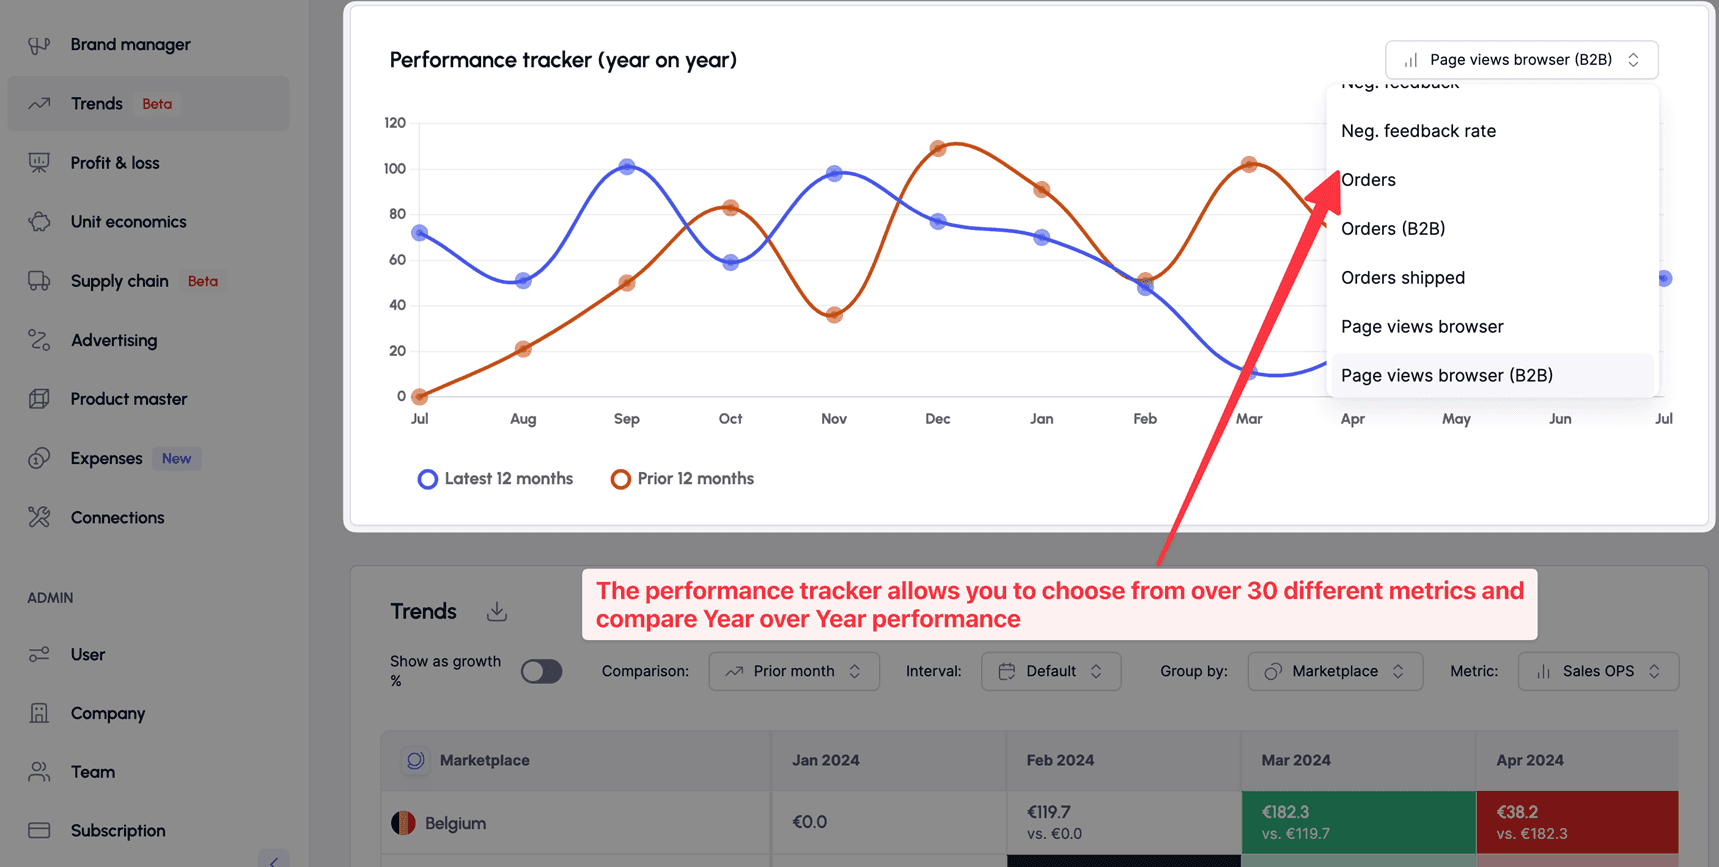
The Performance Tracker, available exclusively for Sales & Traffic metrics, is designed to facilitate year-over-year KPI comparisons. This tool allows you to quickly assess trends in your primary Sales & Traffic metrics over time. To begin, simply select the desired KPI from the dropdown menu located in the upper-right corner of the chart.
Performance Tracker Date Granularity
The Performance Tracker presents data on a monthly basis, covering the past 24 months. Currently, the chart does not support adjustments to weekly or daily intervals.
Why Isn't the Performance Tracker Available for Advertising Metrics?
The Performance Tracker is not available for Advertising metrics because 3fin can only access up to 3 months of historical advertising data from Amazon's Advertising API. This limited data range is insufficient for meaningful year-over-year comparisons.
Trends Table

Using the Trends Table
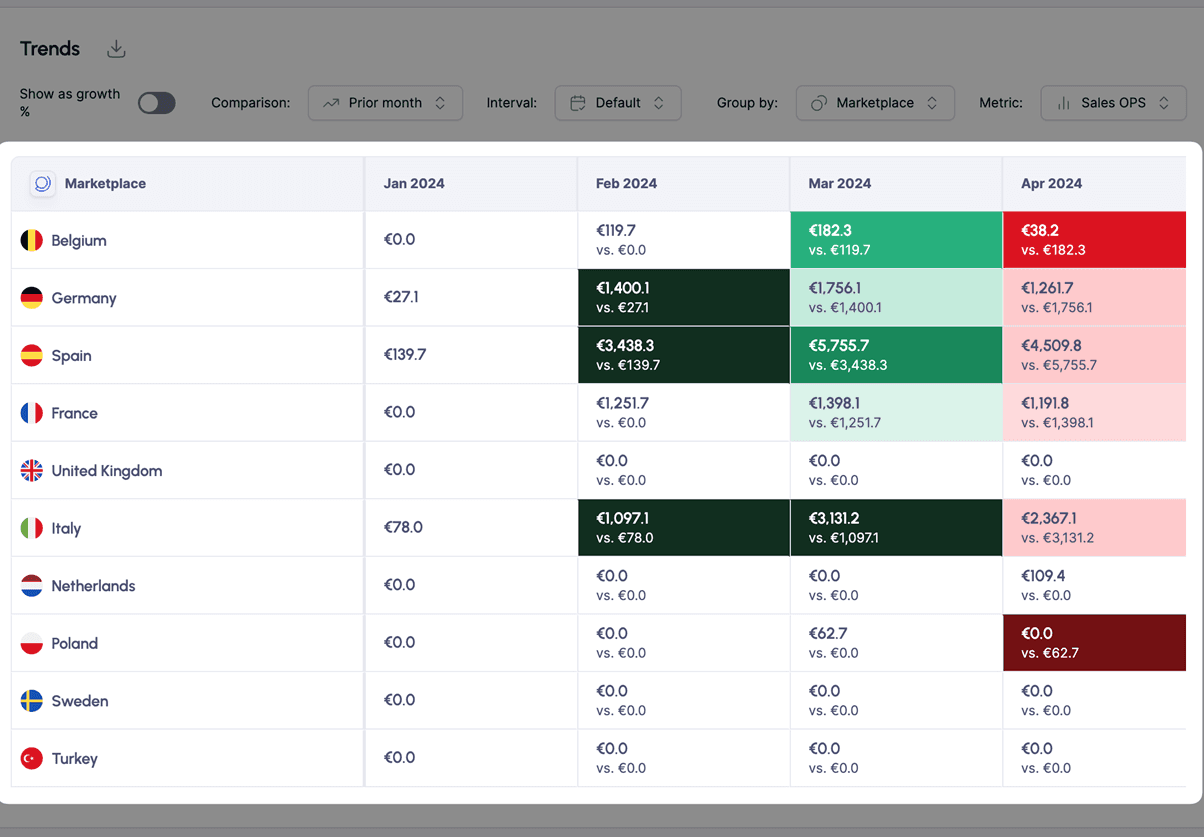
The Trends Table allows you to analyze any Sales & Traffic or Advertising KPI from a selection of over 80 metrics. This tool is highly customizable, enabling you to:
Select the date range for the metrics you want to view.
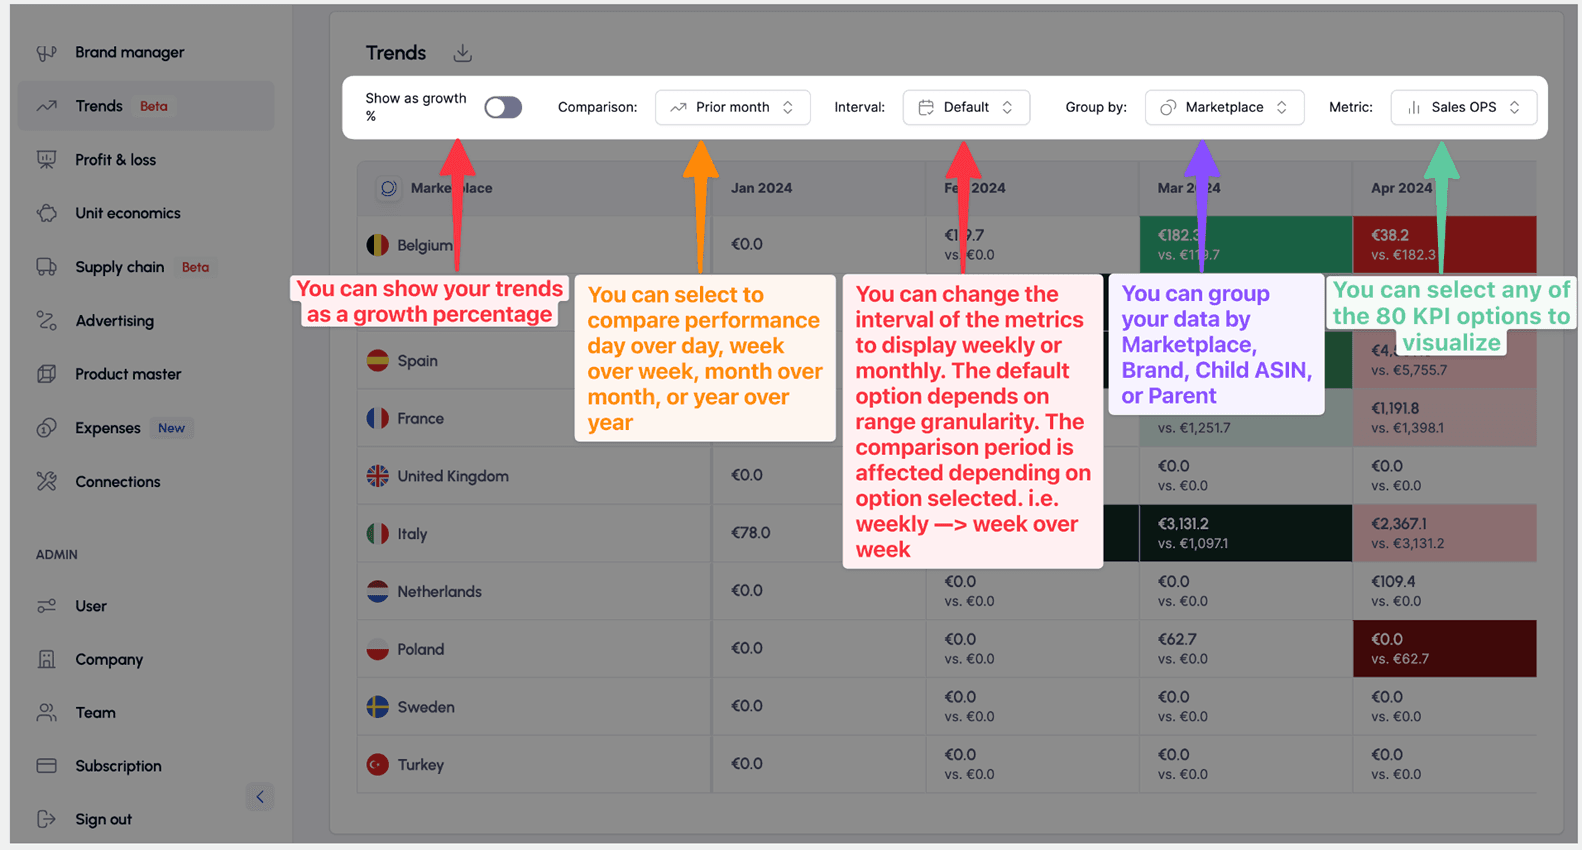
Adjust the date granularity to monthly or weekly intervals. For date ranges shorter than 31 days, the table will default to daily data.
Group your data by brand, marketplace, parent ASIN, or child ASIN.
Display year-over-year (YoY) or month-over-month (MoM) growth trends, either in absolute values or percentages.
Customizing the Trends Table

Check the trends table pictured above for instructions on how to customize the table.
How frequently is the Trends Dashboard updated?
The Trends Dashboard is updated daily. However, some of the Sales & Traffic data from Amazon has a 3 to 6 day lag. As a result, you may only be able to select a date range that ends a few days before today. The Trends Dashboard only includes days for which 3fin has complete data.