Executive Summary
Executive Summary Overview
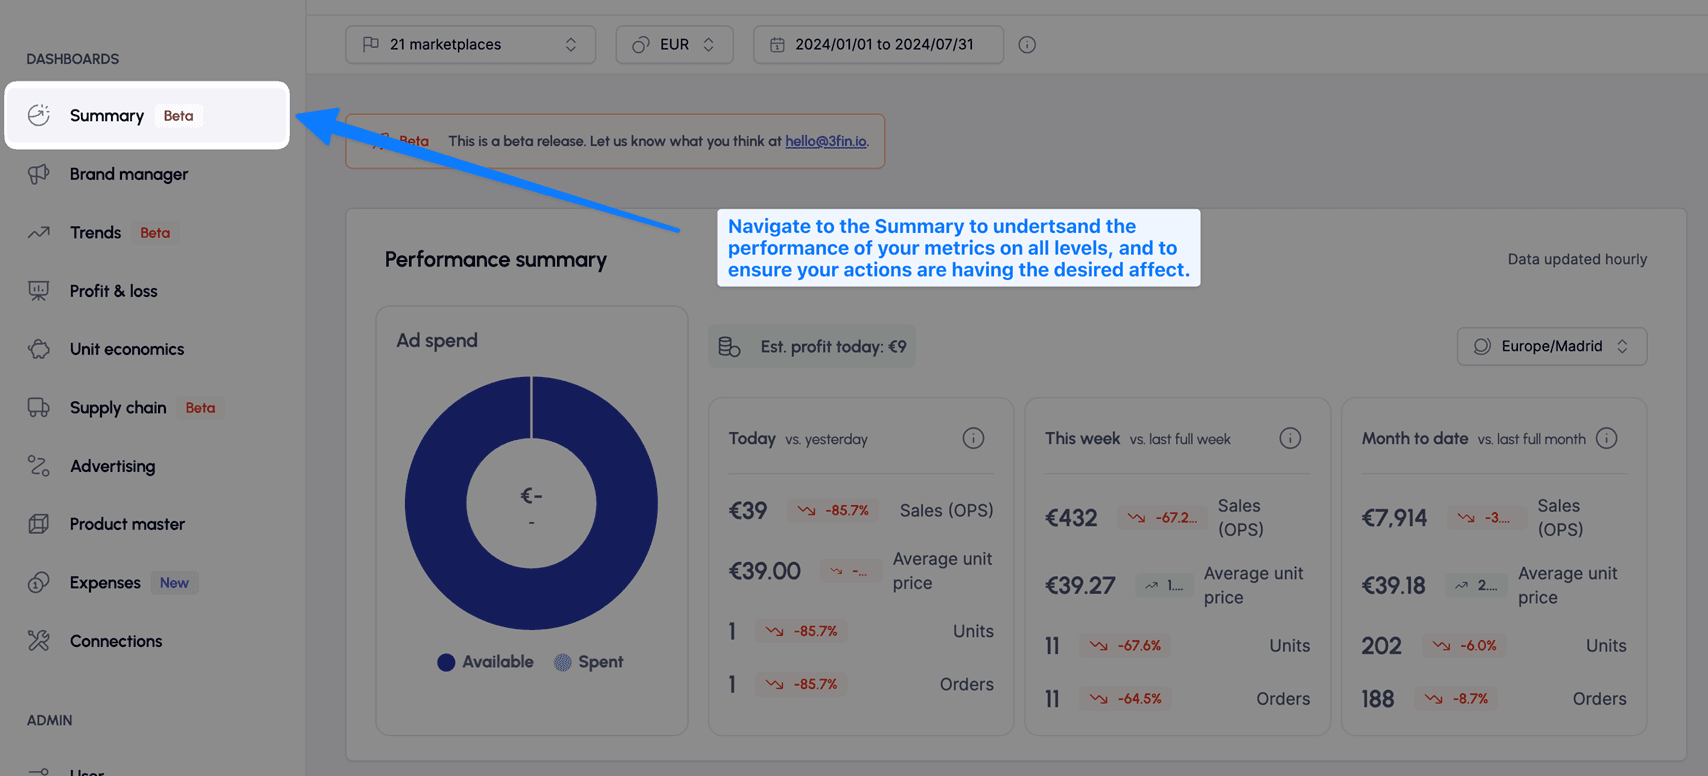
The Executive Summary dashboard provides a concise overview of the key information you need to monitor your business. It is organized into four sections:
Performance Summary: Displays financials for the day, the week, and month-to-date across three tiles.
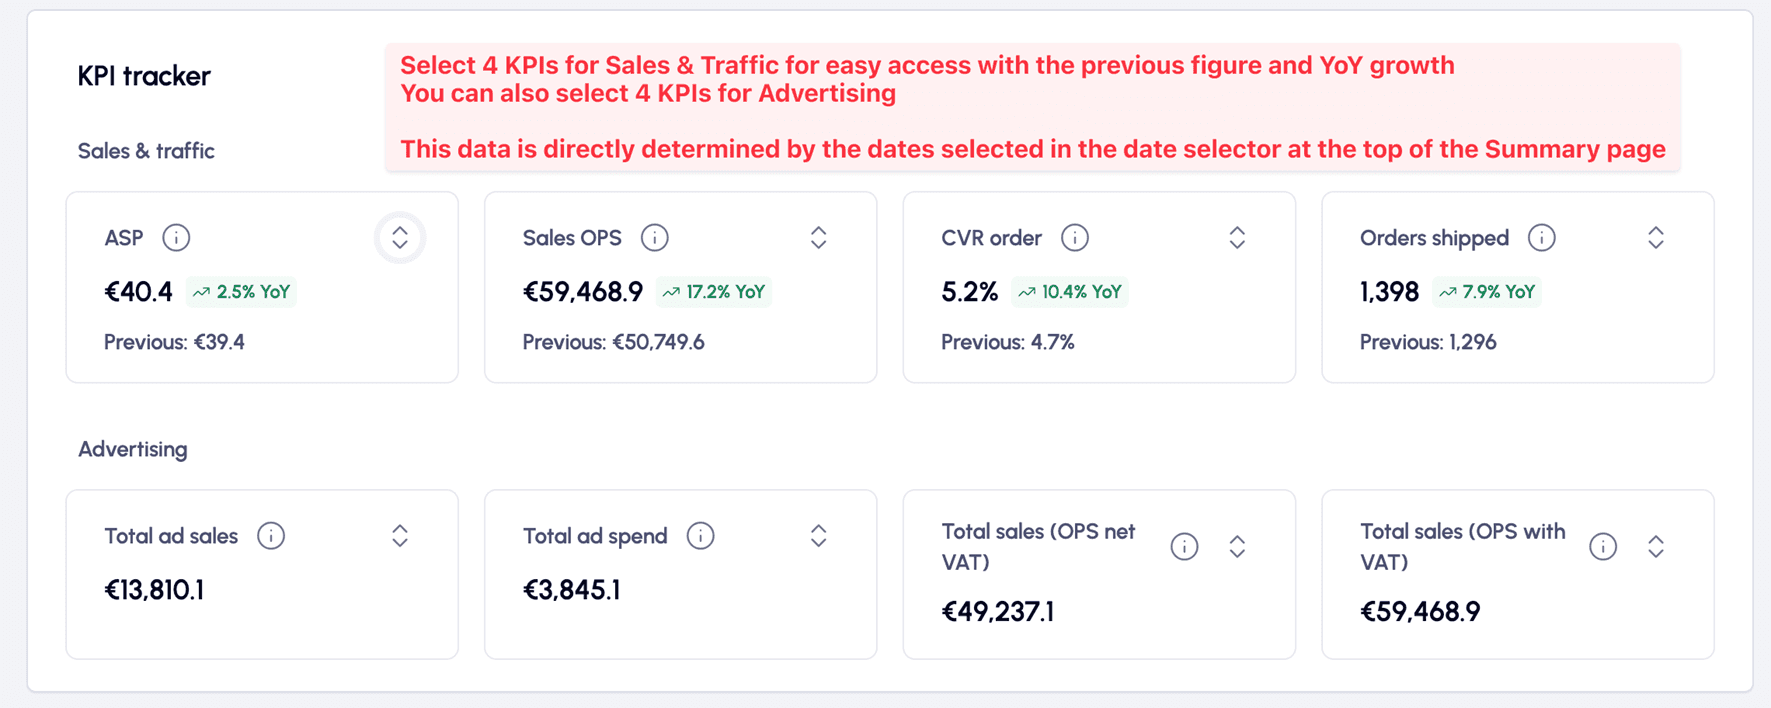
KPI Tracker: Features 4 Sales & Traffic tiles and 4 Advertising tiles, giving you an at-a-glance view of your most critical KPIs.
Child ASIN Watchlist: A table showcasing the most important KPIs for up to 5 ASINs.
Marketplace/Brand Watchlist: A table highlighting key KPIs by marketplace or brand.
The Executive Summary is ideal for quickly assessing your business performance and ensuring you’re on track for growth.
Performance Summary
Ad Spend Pie Chart
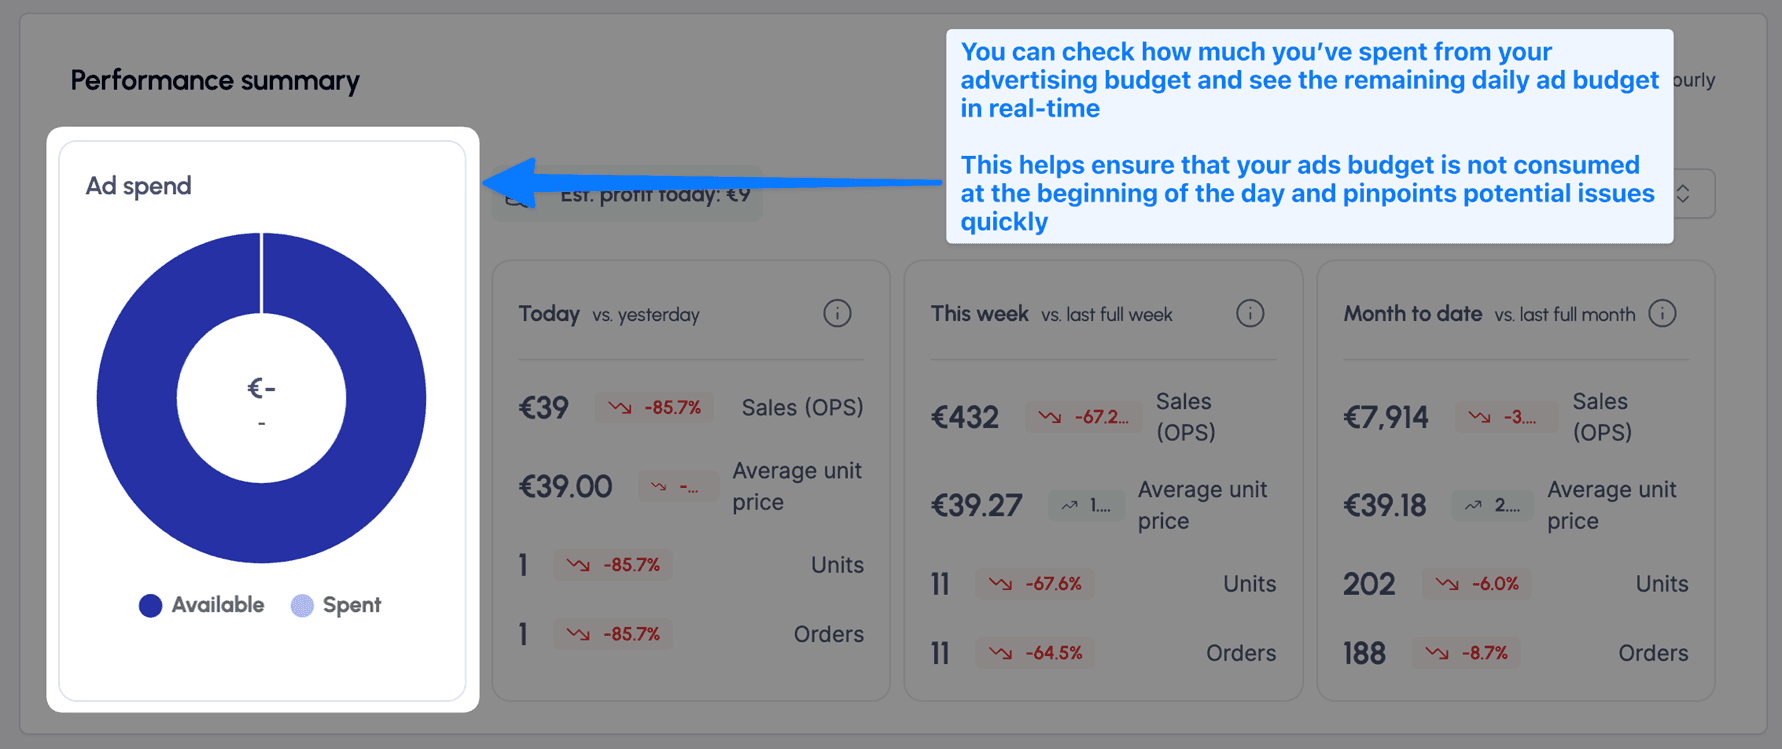
The Ad Spend pie chart informs you about your daily ad budget still available versus what has already been spent.
Understanding the Summary Tiles
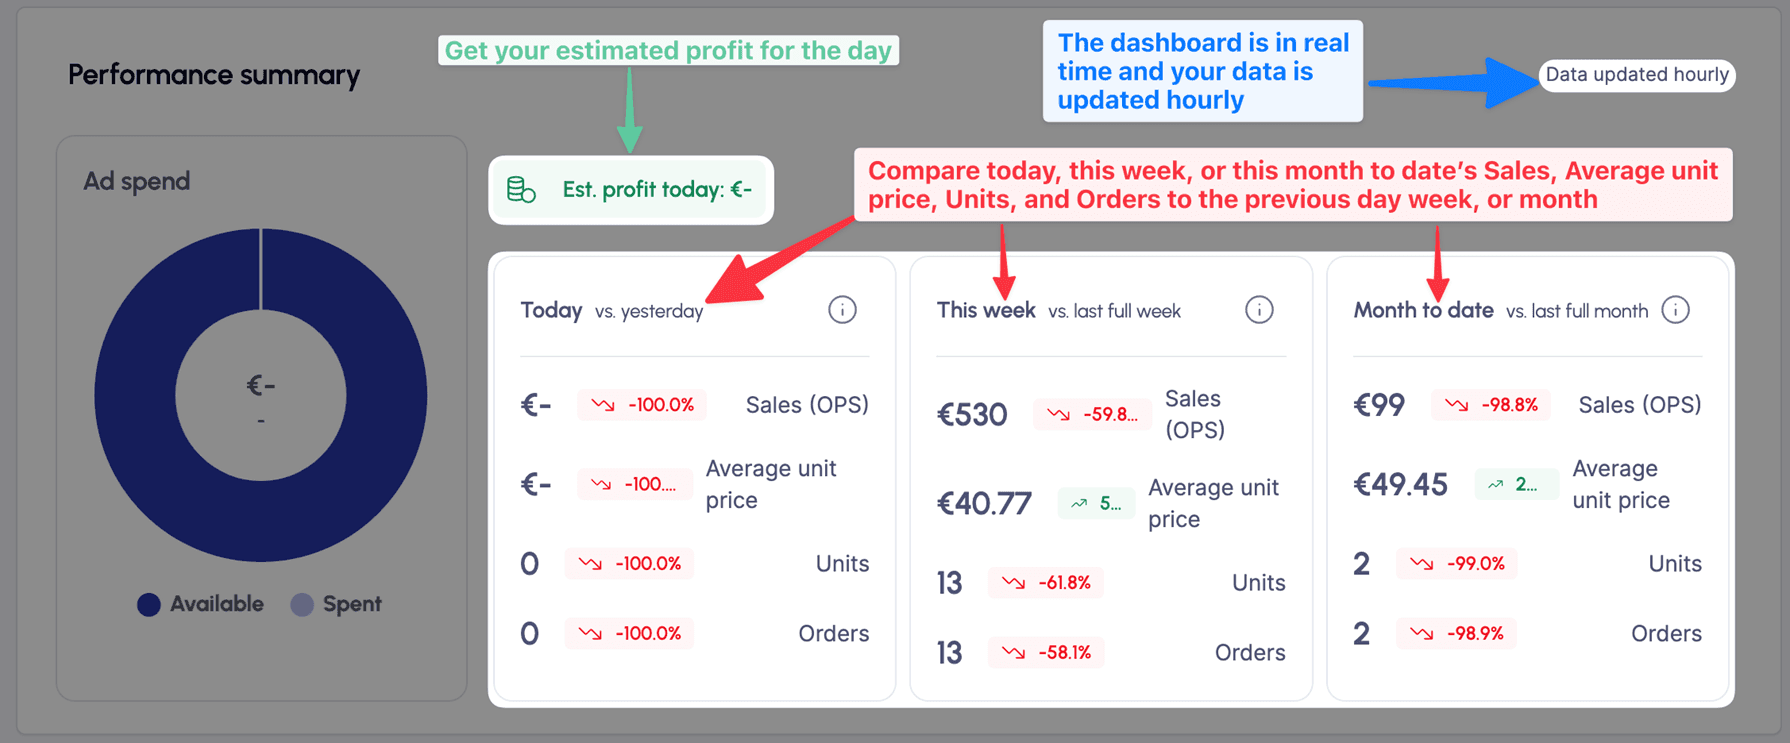
The three summary tiles—Today, This Week, and Month-to-Date—display your key sales metrics:
Sales (OPS): Represents ordered product sales for the period, excluding canceled orders. In European marketplaces, Sales (OPS) is inclusive of VAT.
Average Unit Price: The average sales price of units sold during the period, calculated as Sales (OPS) / Units.
Units: The total number of units sold during the period.
Orders: The total number of orders placed during the period.
For each metric, 3fin provides a trend indicator compared to a previous period:
The Today tile is compared to Yesterday.
The This Week tile is compared to the Last Full Week.
The Month-to-Date tile is compared to the Last Full Month.
In the top left above the Today tile, you’ll find your Estimated Profit for the Day, calculated by multiplying your average profit margin by your Sales (OPS) for the day.
The data in the Performance Summary dashboard is updated hourly. You can select the time zone in the top right corner of the Performance Summary.
KPI Tracker
Customizing the KPI Tracker
Select up to 4 Sales & Traffic KPIs and 4 Advertising KPIs to monitor in the KPI Tracker. The KPIs you choose will dynamically adjust based on:
The selected marketplace(s) at the top of the dashboard
The selected currency
The selected date range
For Sales & Traffic KPIs, 3fin will display year-over-year comparisons (i.e., the same period from the previous year) if the data is available.
Child ASIN Watch List
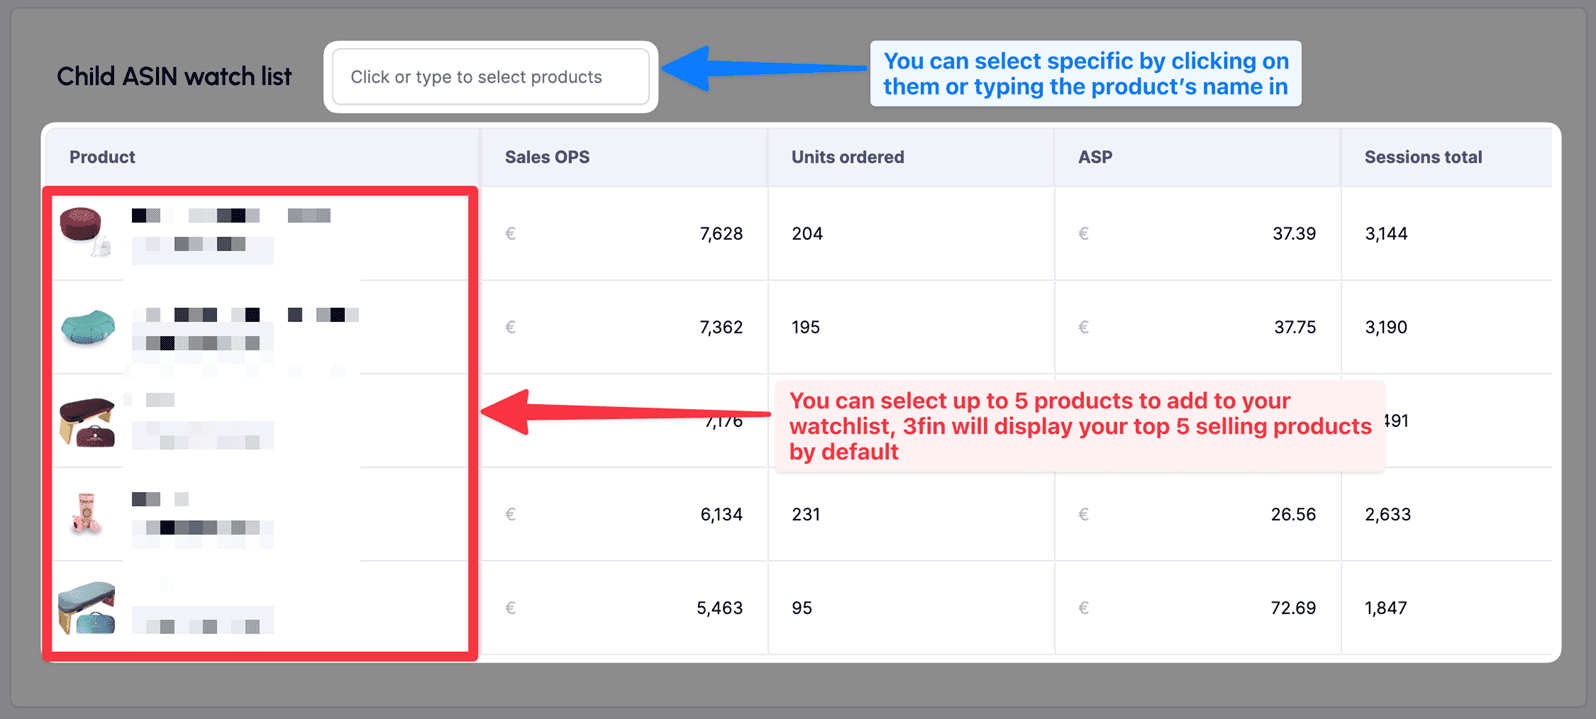
Child ASIN Watchlist Overview
The Child ASIN Watchlist enables you to analyze your business performance at the product level. You can add up to 5 Child ASINs to your watchlist using the search bar located above the table. The table displays the following metrics for the period specified by the date selector at the top of the dashboard:
Sales (OPS): The ordered product sales for the period. In European marketplaces, Sales (OPS) includes VAT.
Units Ordered: The total number of units ordered during the period, including canceled orders.
ASP (Average Selling Price): The average selling price, calculated as Sales (OPS) / Units Ordered.
Sessions Total: The total number of sessions from both browser and mobile app during the period.
CVR (Conversion Rate): The conversion rate, calculated as Orders / Sessions.
Profit: The estimated profit, using the Contribution Margin 3 (CM3) from the P&L as a proxy.
Profit Margin: The estimated profit margin, calculated as Profit / Sales (OPS).
TACOS: The Total Advertising Cost of Sales, calculated as Total Ad Spend / Sales (OPS).
If the selected date range is 31 days or less, 3fin will display a month-over-month comparison. For instance, if the date range is from August 15, 2024, to August 31, 2024, 3fin will compare this data to the period from July 15, 2024, to July 31, 2024.
Marketplace & Brands Watch List
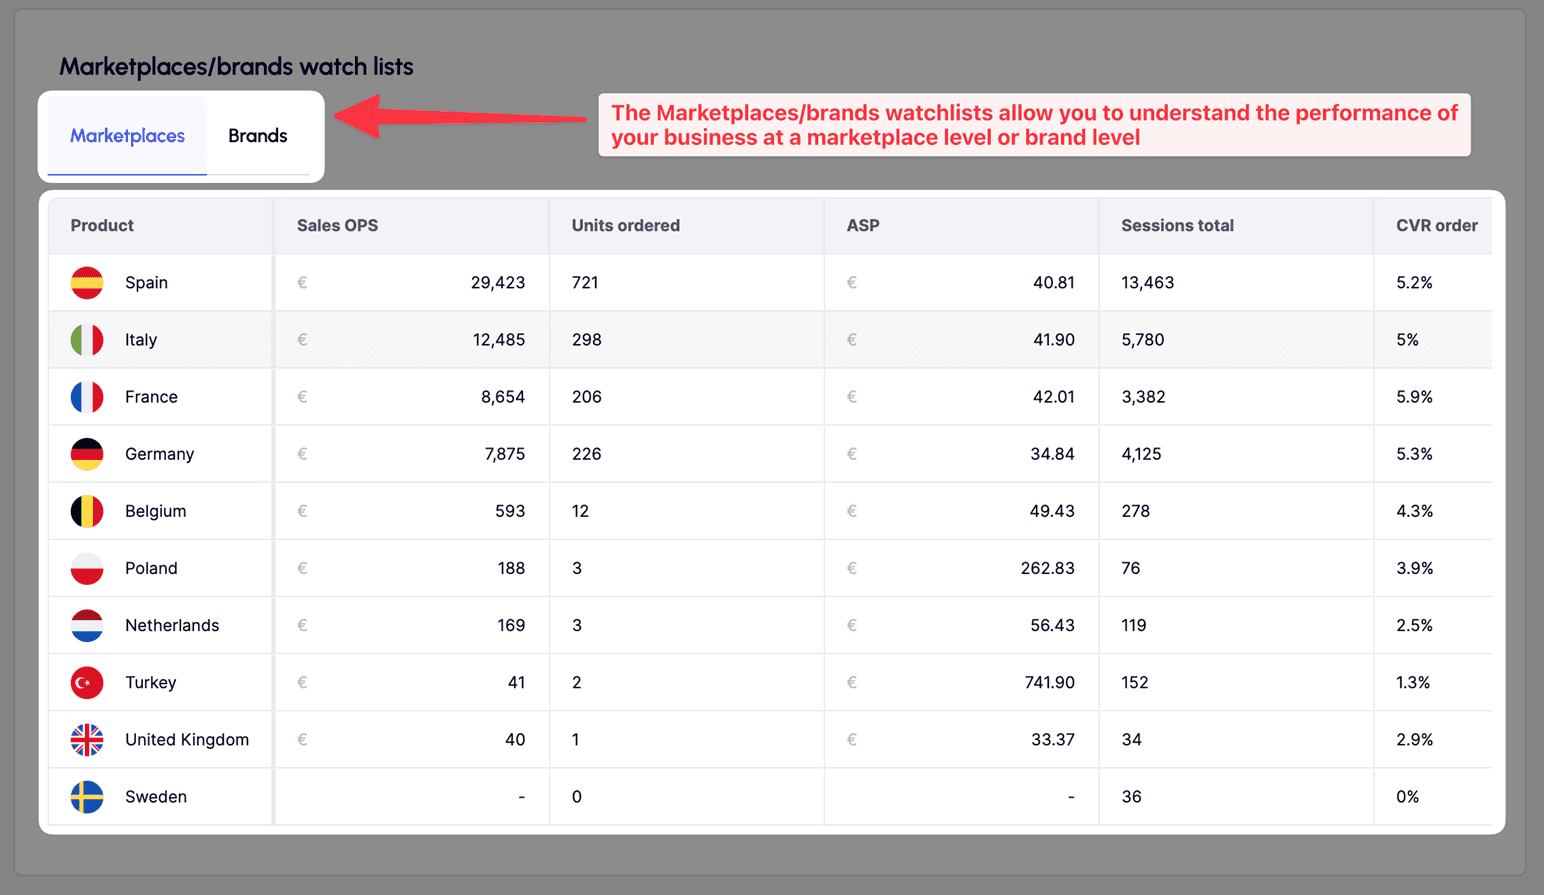
Marketplaces/brands Watchlist Overview
The Marketplaces/Brands Watchlist allows you to analyze your business performance at the marketplace or brand level, depending on the selected tab. This table displays the same metrics as the Child ASIN Watchlist but for all marketplaces or all brands within your account.
The table shows the following metrics for the period specified by the date selector at the top of the dashboard:
Sales (OPS): The ordered product sales for the period. In European marketplaces, Sales (OPS) includes VAT.
Units Ordered: The total number of units ordered during the period, including canceled orders.
ASP (Average Selling Price): The average selling price, calculated as Sales (OPS) / Units Ordered.
Sessions Total: The total number of sessions from both browser and mobile app during the period.
CVR (Conversion Rate): The conversion rate, calculated as Sessions / Orders.
Profit: The estimated profit, using the Contribution Margin 3 (CM3) from the P&L as a proxy.
Profit Margin: The estimated profit margin, calculated as Profit / Sales (OPS).
TACOS: The Total Advertising Cost of Sales, calculated as Total Ad Spend / Sales (OPS).
If the selected date range is 31 days or less, 3fin will display a month-over-month comparison. For instance, if the date range is from August 15, 2024, to August 31, 2024, 3fin will compare this data to the period from July 15, 2024, to July 31, 2024.
FAQ - Executive Summary
On Which Data Is the Executive Summary Dashboard Based?
The Executive Summary Dashboard is primarily based on order data. 3fin pulls data from the Orders API on an hourly basis to provide the most up-to-date metrics in the Performance Summary. The KPI Tracker and Watchlists, however, are based on Traffic & Advertising metrics retrieved from the Sales & Traffic and Advertising reports. As a result, these metrics may have a 3 to 6 day lag.