Advertising
Advertising Dashboard - Overview
The Advertising Dashboard is designed to track your advertising spend and the return-on-investment (ROI) from your advertising efforts.
The dashboard features 4 main sections:
Metrics Suite: fully customizable summary tiles with more than 50 metrics you can choose from
Sales & Profit Chart: a bar chart that allows you to see your (i) your total sales & profit ; (ii) your organic sales & profit ; and (iii) your paid sales & profit
Organic vs Paid Chart: a line chart that lets you compare various metrics between organic and paid. For example, compare your organic traffic vs. paid traffic.
Advertising Table: a table summarizing business metrics, traffic metrics, advertising metrics, and organic metrics. You can view the table by marketplace, by brand, by parent or by child ASIN.
Where does the data come from?
The Advertising dashboard combines data from:
the Sales & Traffic reports (aka business reports)
the Finances API
Amazon Ads Campaign Report Sponsored Brands
Amazon Ads Campaign Report Sponsored Display
Amazon Ads Campaign Report Sponsored Products
Amazon Ads Advertised Product Report Sponsored Display
Amazon Ads Advertised Product Report Sponsored Products
3fin will retrieve the last 60 to 90 days of historical advertising data upon first connection the Amazon Ads API. Unfortunately, Amazon currently does not provide historical data older than that.
Advertising Dashboard - Metrics Suite

Metrics are divided into 4 sections:
Business metrics: focus on sales and profit – track sales and profit targets
Traffic metrics: look at traffic generated and conversion rates – easily find products with low traffic to find product page issues
Advertising metrics: focus on revenue generated, ad spend, traffic generated, and return generated from paid advertising (Sponsored Products, Brand, Display)
Organic metrics: understand how much revenue, traffic, conversion and profit is generated without having to spend money on sponsored placement
The eight tiles of the metrics suite are fully customizable: you can choose from more than 50 metrics related to sales, traffic or advertising.
For every tile, you get the following information:
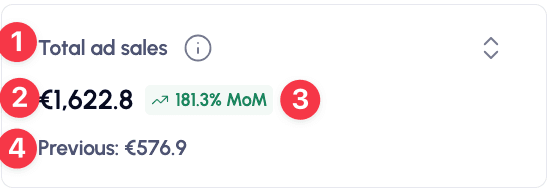
Metric name: you can hover over the information (i) button to get a description of the metric
Amount or %: shows the value of the metric for the selected date range
% MoM: shows the month-over-month (MoM) evolution of the metric. For example, in the image above, total ad sales grew by 181% over the period 2024-08-01 to 2024-08-31 versus the prior period, which would be from 2024-07-01 to 2024-07-31. Note that the % MoM growth will only be shown if 3fin has data for the selected metrics in both the current period AND in the prior (comparison) period.
Previous: shows the amount or percentage for the selected metric in the period before. For example, if the current period is August 1, 2024 to August 31, 2024, the previous amount (or percentage) will be for the period July 1, 2024 to July 31, 2024. Note that the previous amount (or percentage) will only be shown if data is available for the prior period.
The Metrics Suite tiles will take into account any filters you have selected in the top bar. Hence, it can be filtered by marketplace, brand, product or tag.
Sales & Profit Graph
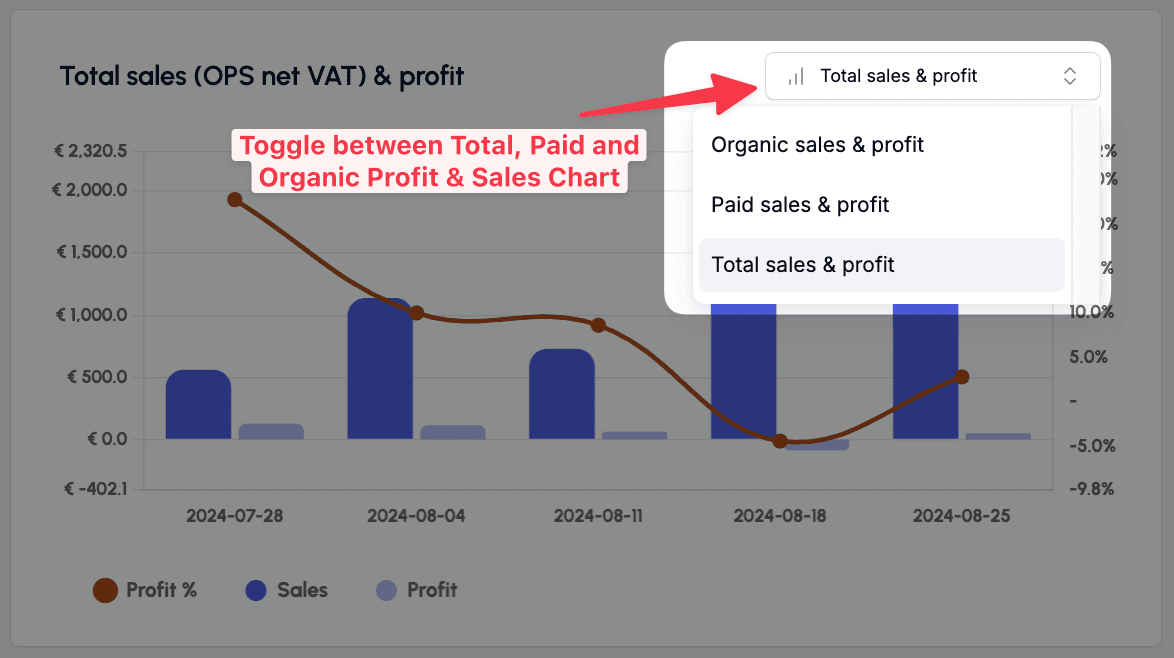
The Sales & Profit chart is essential to understand the impact of your advertising efforts on both your sales and profits. Use the toggle in the top right corner to switch between:
Total sales (OPS net VAT) & profit chart: displays a bar chart with your sales, profit and profit margin %. Takes into account both organic and paid sales.
Sales are defined as “Ordered Product Sales”, as provided in Amazon’s Sales & Traffic Reports. For sales coming from European countries, 3fin subtracts the estimated VAT amount to show sales net of VAT (hence the name OPS net VAT). Ordered Product Sales includes all sales, regardless of whether they are organic or ppc-driven.
Profit corresponds to the Contribution Margin 3 (CM3) from the P&L dashboard. As such it is defined as Sales - COGS - Amazon Fees - PPC Cost.
Profit % is calculated as Profit / Total sales (OPS net VAT). Note that since Total sales (OPS net VAT) might be an estimate in European countries, the Profit % will also be an estimate.
Organic sales & profit chart: displays a bar chart with only your organic sales, profits and profit margin %. This chart does not include sales driven by advertising efforts.
Organic sales is an estimate defined as Total sales (OPS net VAT) - Paid sales.
Organic profit is defined as the % Organic Sales * Contribution Margin 2 (CM2) from the P&L dashboard. This is an estimate.
Organic profit % = Organic Profit / Organic Net Revenue
Paid sales & profit chart: displays a bar chart with only your paid sales, profits and profit margin %. This chart does not include organic sales.
Paid sales is derived from the Total ad sales metric. Total ad sales is defined as the total sales generated across all Amazon ads types for purchases made within 7 to 14 days of an ad click.
Paid profit is an estimate defined as Total profit - Organic profit
Paid profit % = Paid profit / Paid sales
Note that both organic and paid sales are estimates. As Amazon does not provide a clear breakdown between organic and paid sales, 3fin calculates the breakdown by using a variety of data points such as your 14*-day attributed sales*, your total ordered product sales etc.
Organic vs. Paid Chart
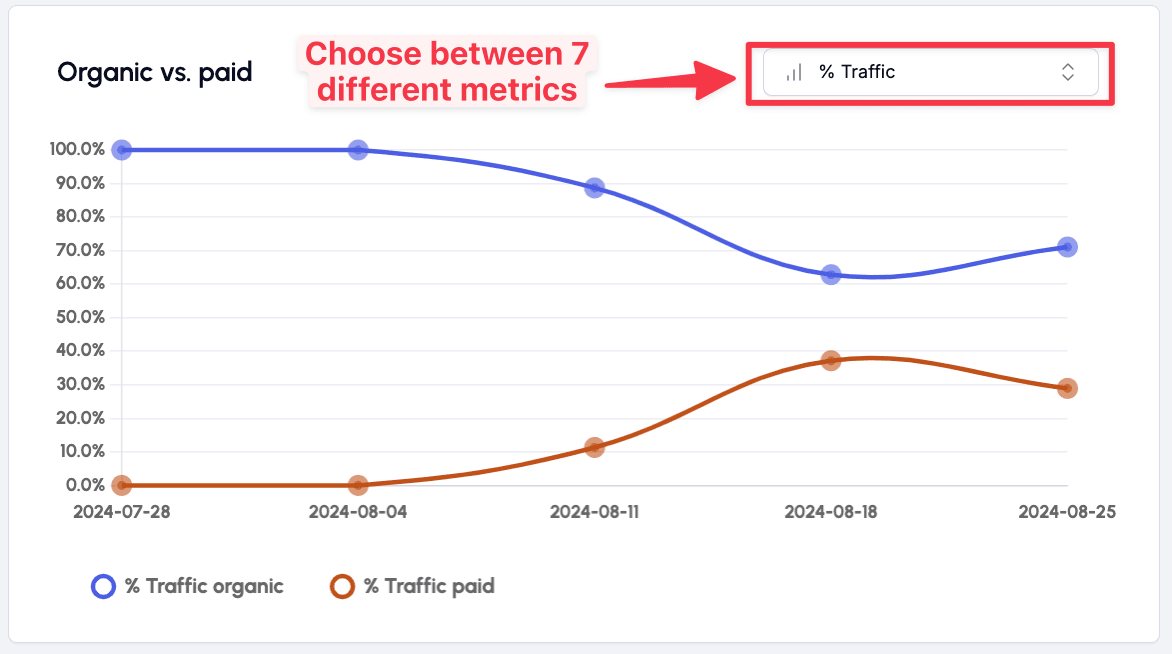
The Organic vs. Paid chart provides a comprehensive comparison of seven key metrics to help you assess the effectiveness of your advertising efforts. By analyzing these metrics, you can gain valuable insights into the impact of organic versus paid traffic on your business performance:
% Traffic: Evaluate the percentage of traffic to your listing pages that originates from sponsored ads compared to organic search results.
Conversion Rate: Compare the conversion rates of visitors who find your listings organically versus those who arrive via sponsored ads.
Orders: Track the number of orders generated from organic traffic versus paid advertising to determine which source drives more sales.
Units Sold: Analyze the number of units sold through organic searches versus sponsored listings to identify the most effective sales channel.
Sales: Compare the revenue generated from organic versus paid sales to understand what contributes most to your top line.
Profit: Examine the profit derived from organic traffic compared to paid advertising to see how much of your bottom line is influenced by your marketing efforts.
Profit Margin: Assess the profit margin for organic versus paid traffic. Typically, organic profit margins are higher, but the critical factor is the gap between the two. If your paid profit margin is negative or only marginally positive, it may be time to reassess your marketing strategy.
Advertising Table
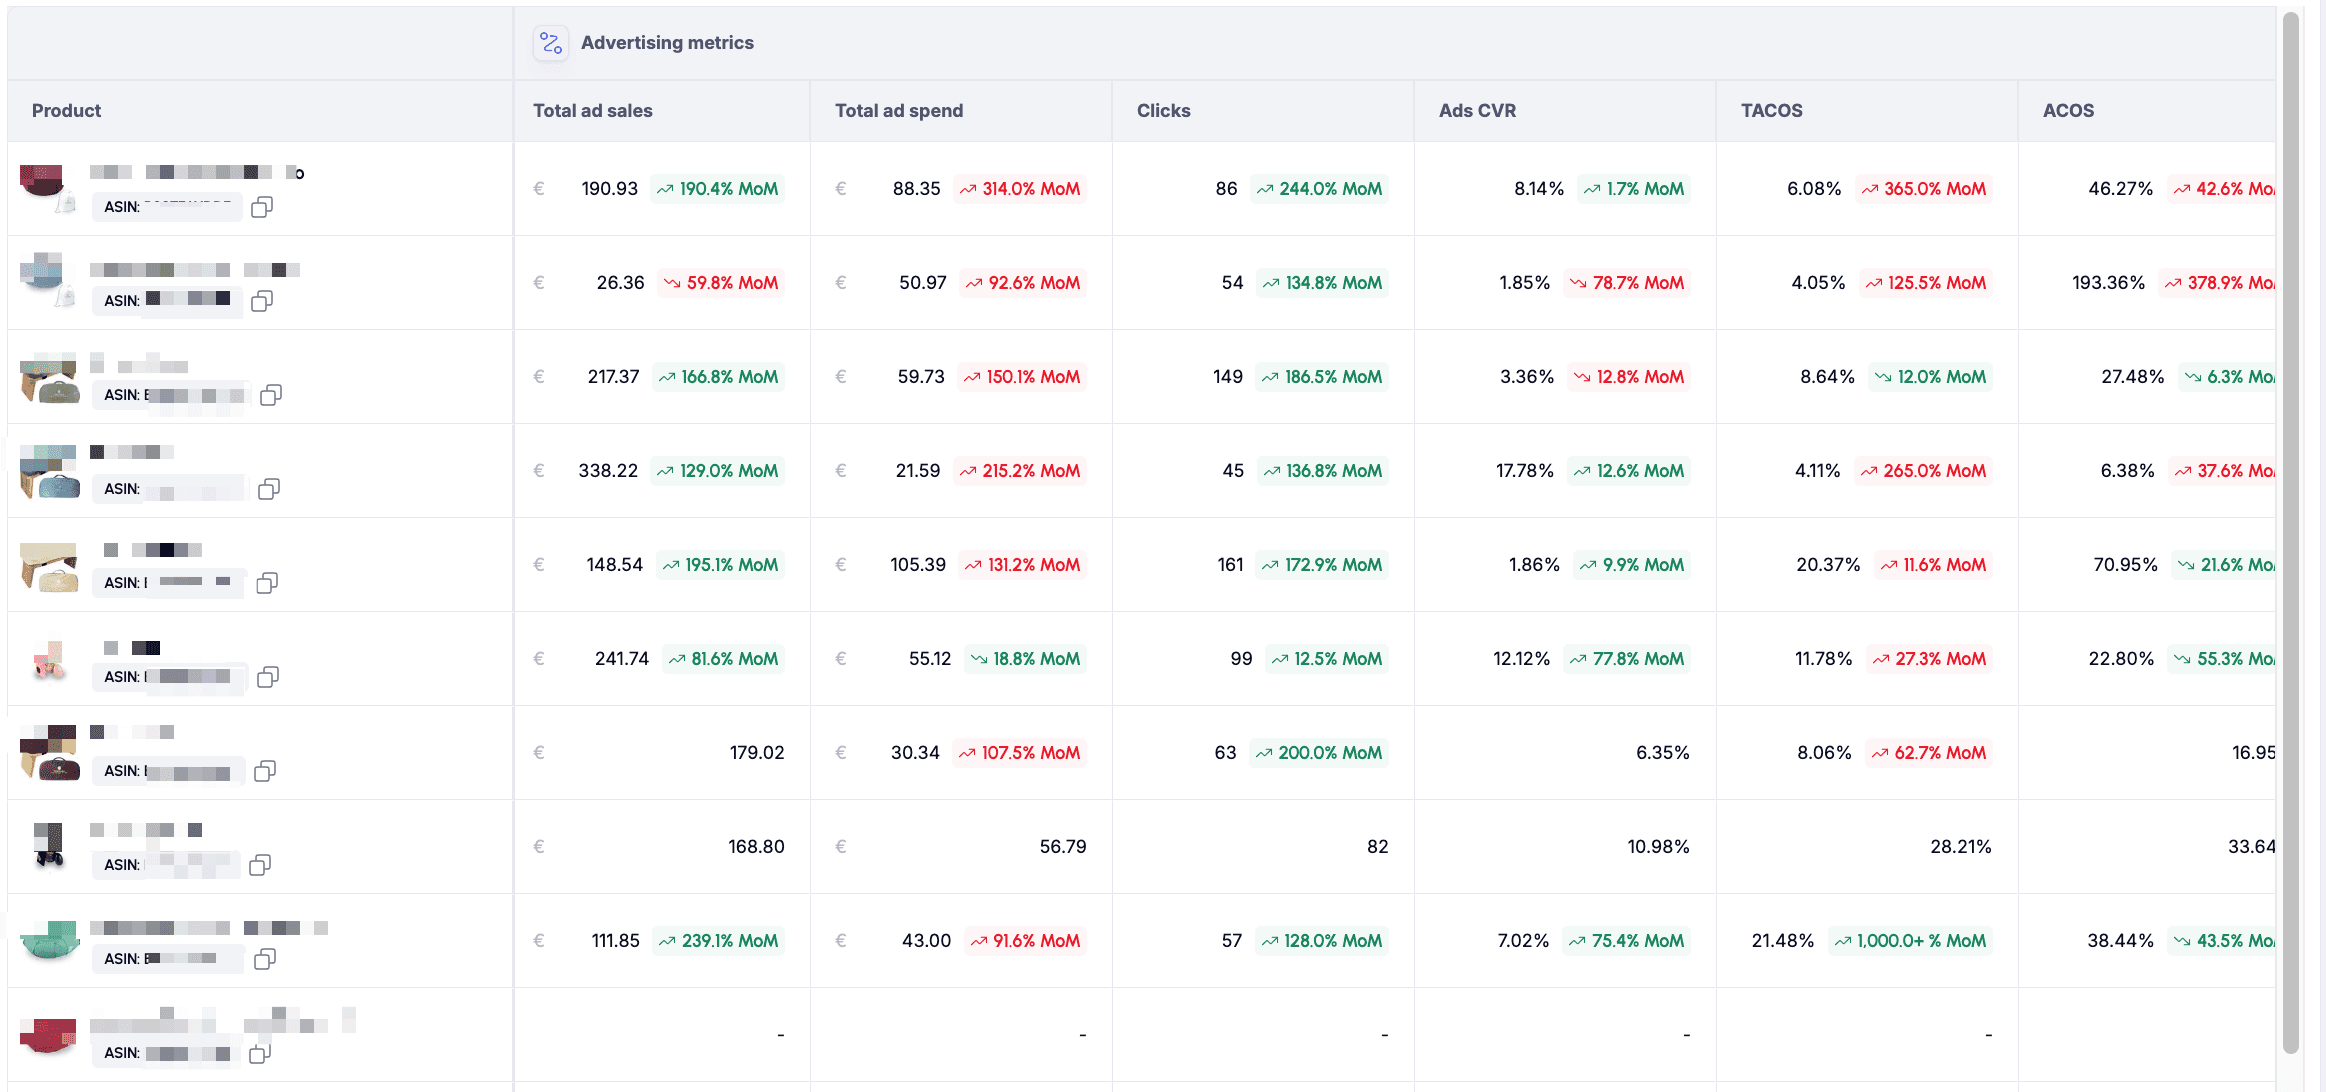
The advertising table is the ultimate dashboard for your daily operations. The table is divided in four main sections, each regrouping specific metrics:
Business metrics: focus on sales and profit – track sales and profit targets
Traffic metrics: look at traffic generated and conversion rates – easily find products with low traffic to find product page issues
Advertising metrics: focus on revenue generated, ad spend, traffic generated, and return generated from paid advertising (Sponsored Products, Brand, Display)
Organic metrics: understand how much revenue, traffic, conversion and profit is generated without having to spend money on sponsored placement
By default, the table is:
grouped by “Child”: every row displayed corresponds to a Child ASIN.
sorted by Sales OPS (net VAT) descending: you can click on the header to sort it by Sales OPS (net VAT) ascending.
displaying only 15 ASINs (rows): click on the page selector on the top right corner of the table to move to the next page
You can easily change the table grouping to make each row a Child ASIN, Parent ASIN, Marketplace, or Brand, depending on your needs. Simply click “Group by” button on the top left of the dashboard.
Business Metrics Section

Use case: these indicators are some of the most important for an Amazon business – you can track these metrics on a weekly or monthly basis to understand the opportunities for improvement at a product level. Quickly glance at the growth indicators to see if your sales and profits are growing for each ASIN.
Traffic Metrics Section
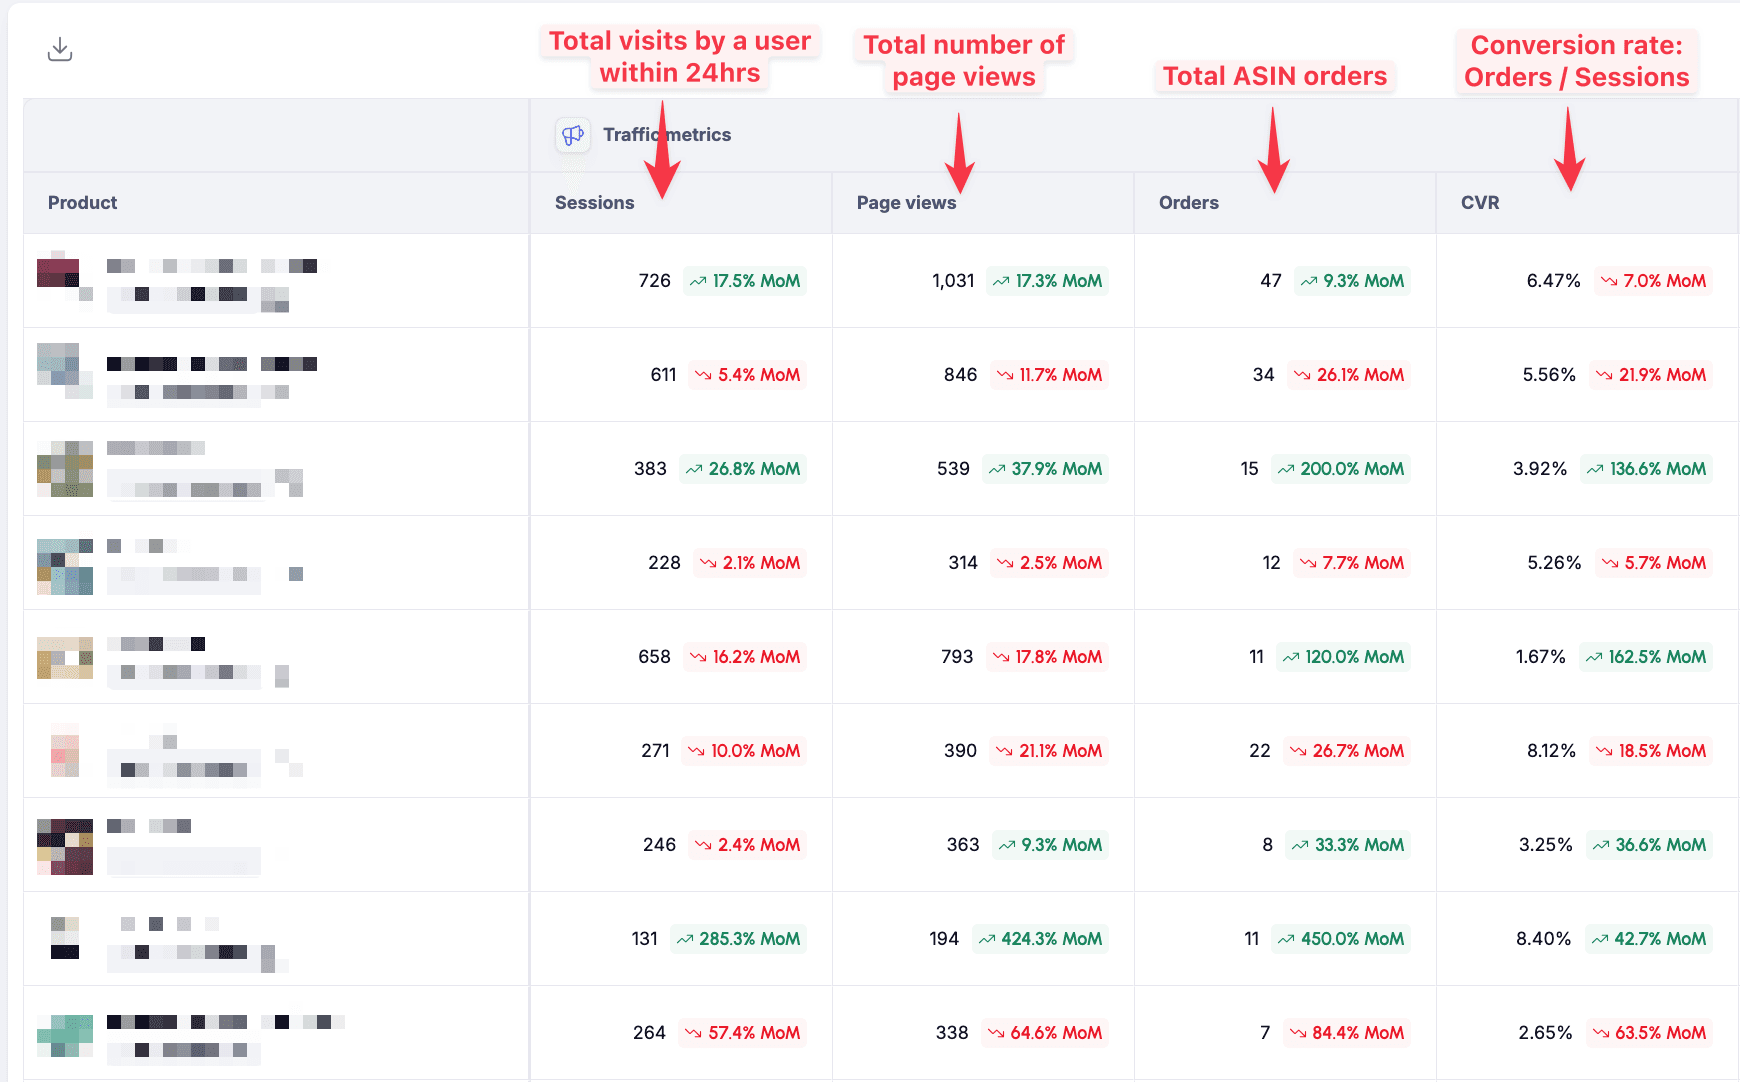
The traffic section regroups four key metrics related to your traffic:
Sessions: The total number of user sessions on your Amazon product pages via a browser or mobile app within a 24-hour period.
Page views: The combined total of page views from both the mobile app and web browser.
Orders: The total number of order items ordered for the selected time period.
CVR: The conversion rate calculated as Orders / Sessions
Use Case: Traffic is a crucial factor in Amazon's appeal to businesses, as the platform attracts billions of visits each month, each representing a potential customer for sellers. Tracking traffic is straightforward, and we focus on sessions, which measure unique visitors to your product, alongside conversion rate.
Sessions and conversion rate (CVR) are vital metrics to monitor due to their significant influence on your sales performance. If you notice a decline in sales for a specific ASIN, it's important to determine whether the issue stems from a decrease in traffic (sessions) or a drop in the conversion rate.
Advertising Metrics Section

The Advertising section regroups metrics related to your advertising spend and sales, as well as the most common advertising ratios (TAOCS, ACOS, ROAS). Here is an overview of the 7 metrics included in that section:
Total ad sales: Total sales generated across all Amazon ads types for purchases made within 14 days of an ad click
Total ad spend: Total ad spend across all Amazon ads types: Sponsored Products, Sponsored Display and Sponsored Brands.
Clicks: Total number of ad clicks from sponsored product, sponsored display and sponsored brand ads.
Ads CVR: Conversion rate (CVR) across all Amazon ads types for purchases made within 14 days of an ad click. Calculated as: Ad Orders / Clicks
TACOS: Total Advertising Cost of Sales (TACOS) across all Amazon ads types for purchases made within 14 days of an ad click. Calculated as: Total ad spend / Sales OPS (net VAT)
ACOS: Advertising Cost of Sale (ACOS) across all Amazon ads types for purchases made within 14 days of an ad click. Calculated as: Total ad spend / Total ad sales
ROAS: Return on Ad Spend (ROAS) across all Amazon ads types for purchases made within 14 days of an ad click. Calculated as: Total ad sales / Total ad spend
Use Case: Keeping your advertising costs under control is essential for maintaining profitability. It’s not just about tracking what you spend and how much revenue you generate—you need to understand how profitable your advertising efforts really are. For example, if your product’s total sales double but 90% of those sales come from costly advertising, you might be spending more than you’re earning in profit. To make sure your advertising spend is working for you, keep an eye on key metrics like TACoS (Total Advertising Cost of Sales) and Ad Sales Profit. This will help you ensure that your investment in advertising is driving meaningful growth for your business.
Organic Metrics Section
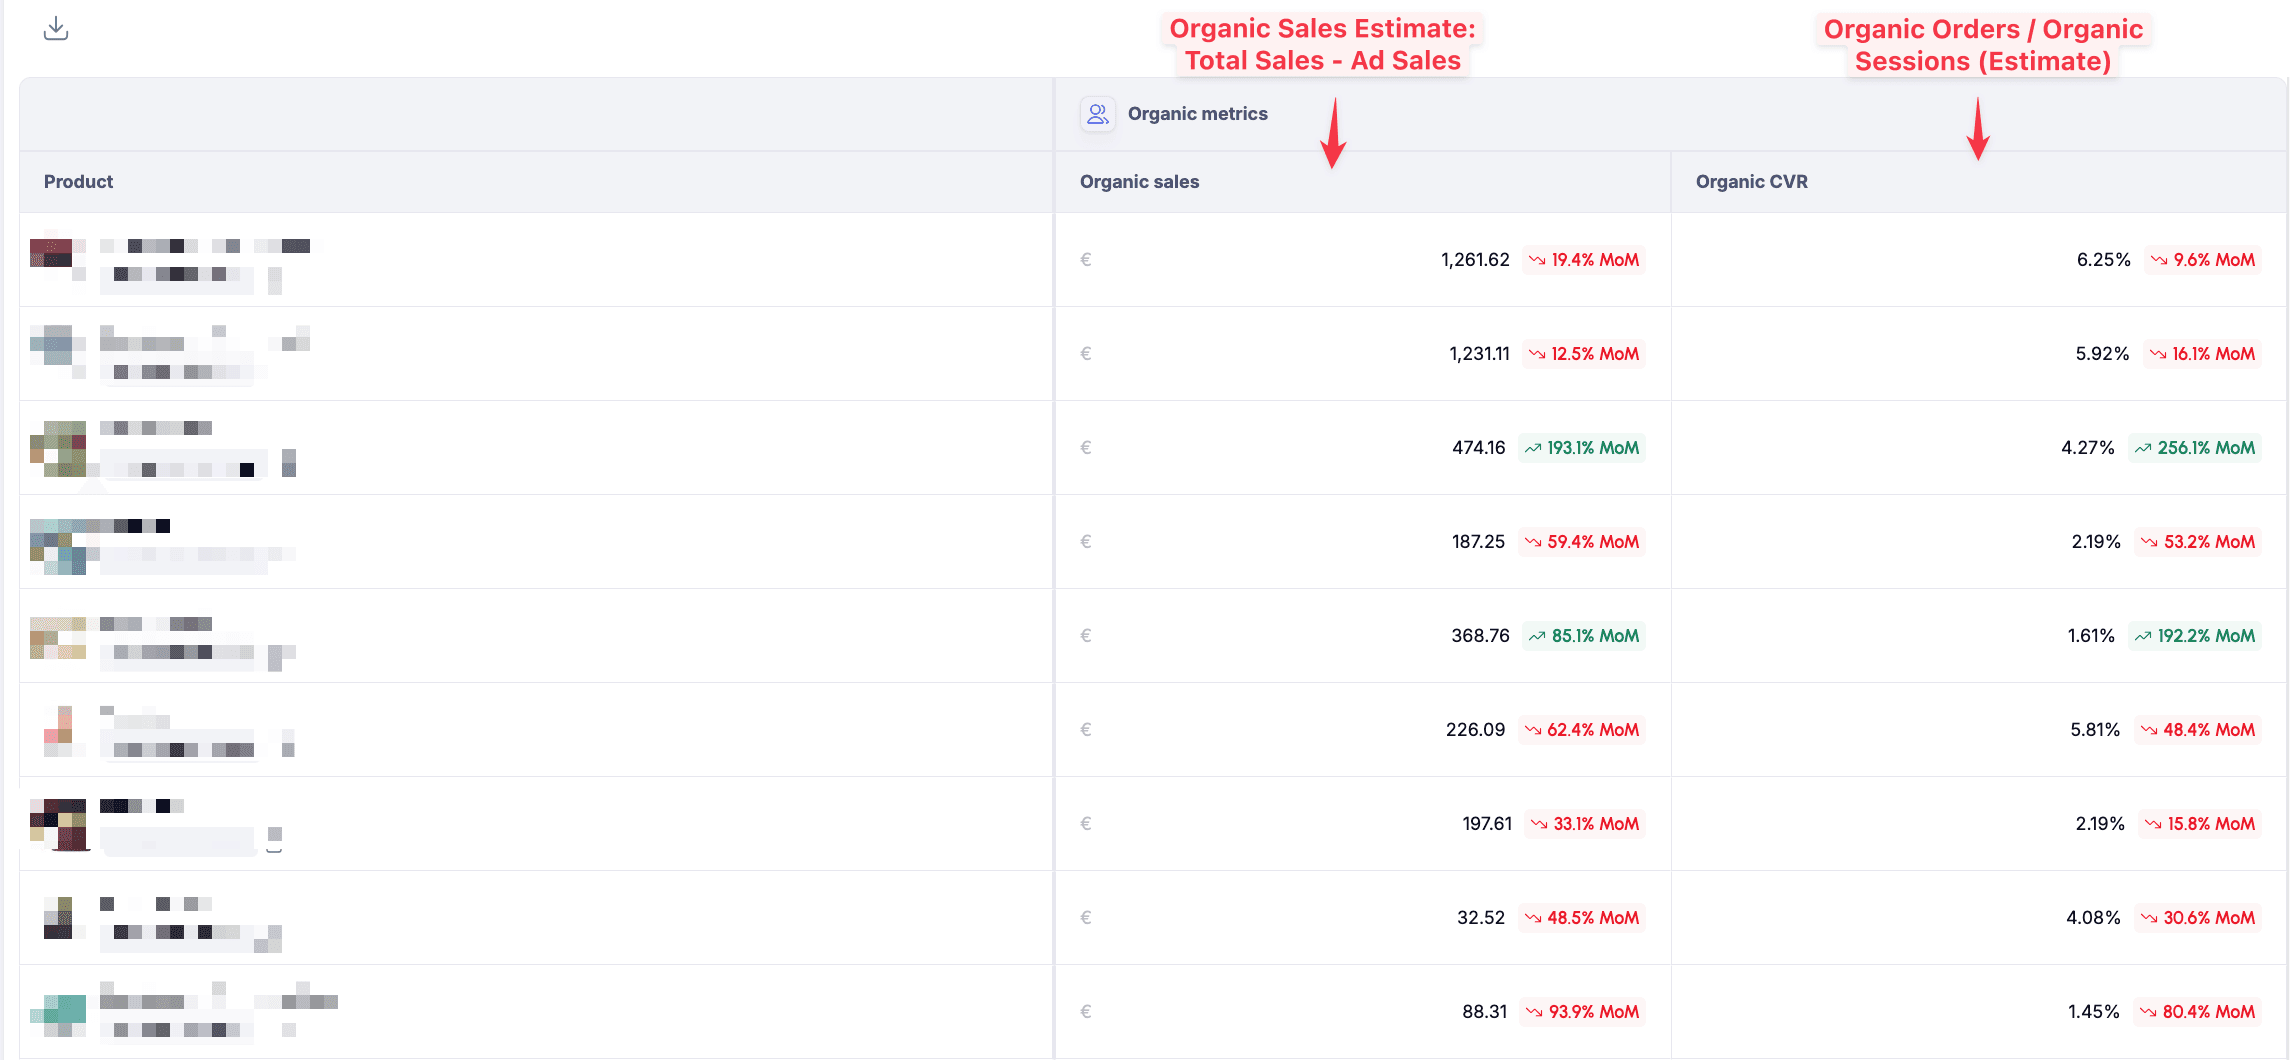
This section highlights your organic sales and organic conversion rate (CVR). These metrics are defined as follows:
Organic Sales: Estimated as Total Sales (OPS net VAT) minus Paid Sales.
Organic CVR: Estimated as Organic Orders divided by Organic Sessions.
Monitoring these two metrics is crucial: the more you can grow them, the more you can increase your profitability.
FAQ - Advertising
How frequently is the Advertising Dashboard updated?
The Advertising Dashboard is updated daily. However, due to a 3 to 6 day lag in the metrics from Amazon’s Sales & Traffic reports, there may be a delay in the reporting of the most recent data.
Why can’t I select the most recent days in the date selector of the Advertising Dashboard?
While 3fin retrieves data daily from Amazon’s API, some reports (e.g. sales & traffic) experience a 3 to 6 day lag, preventing 3fin from accessing the most recent data. As a result, you can only select a time range that includes days for which 3fin has complete data.
Can I select a year-over-year (YoY) comparison in the metrics suite?
Is is currently not possible to show YoY comparisons on the Advertising dashboard due to data limitations coming from Amazon.
Can I see the metrics suite data only for a specific product / brand / marketplace ?
Yes, you can use standard 3fin filters to only show the data for a specific marketplace / brand / product. Use the search bar to enter a specific product or tag for which you would like to see the data
Why is no data being shown for some historical months?
Upon connection to the Advertising API, 3fin is only able to retrieve 60 to 90 days of historical advertising data. As such, when you first connect to 3fin, the advertising data available will only include the past 3 months.